
.png)
UK, England and Wales data
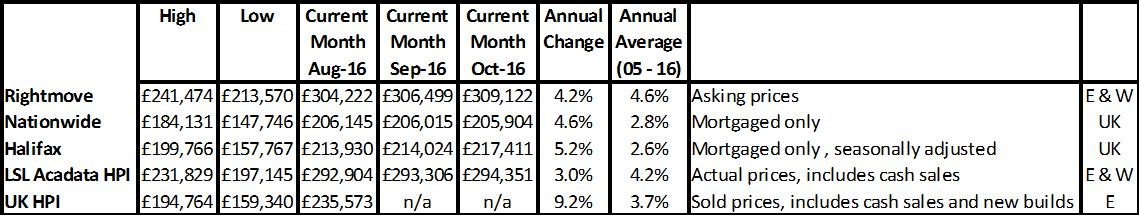
Although the property prices in the table are measuring different stages of the market and different areas, for the first time this year there seems to be a consensus on current growth rates of 3-5% year on year. All of the indices show that the market growth is slowing but that’s not a surprise; London has basically run out of steam and the rest of the UK is not picking up the ‘slack’ as much as it has done following previous recessions.
For more, download my comprehensive property price report.
What's happening in the regions?
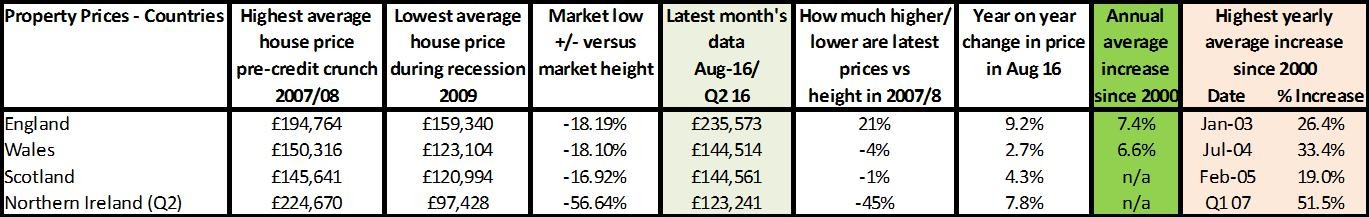
Source: UK HPI
England continues to outstrip other country growth, mainly due to the strength of London and the South (remember UK HPI data is a few months behind other indices). Wales and Scotland are growing year on year, but still haven’t overtake 2007 heights - meaning it will be a good 10 years for them to recover prices at a nominal level, let alone catch up with prices taking inflation into account. Northern Ireland may be showing strong growth year on year but this is still from an extremely low base and we may see the UK’s first evidence of a ‘real’ house price bubble there, where prices for some properties just never recover to their 2007 levels.
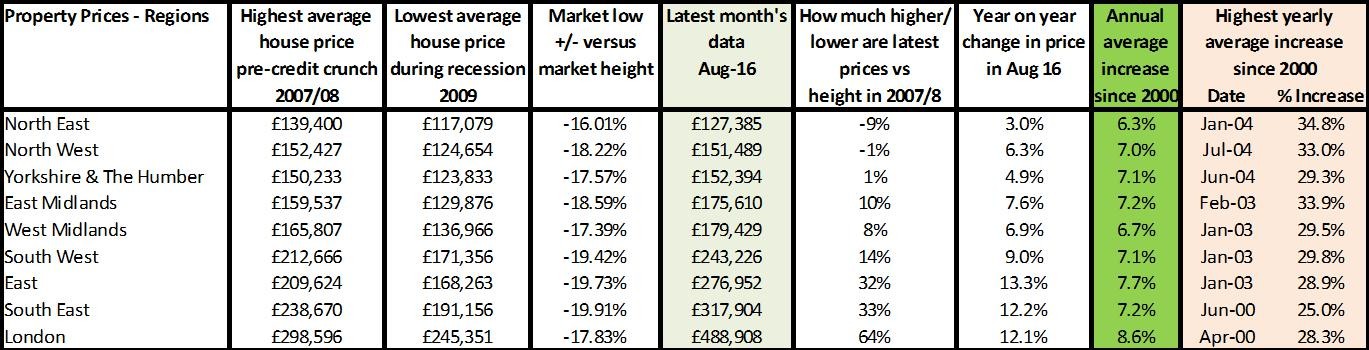
Regionally, LSL give a handy guide to property price growth across the country. According to LSL, rates of growth can be divided into three: the likes of East of England, South East and West show strong 5-7% growth; the West and East Midlands are showing ‘moderate’ growth of around 4%; while the North West, North East and Yorks & Humber are seeing around 1% rises. It’s unlikely this will change much moving forward and we may well just see rates in the South, West and Midlands reduce to Northern levels of hardly any growth.
Looking to buy for the first time but confused about the market? Read our quick guide.
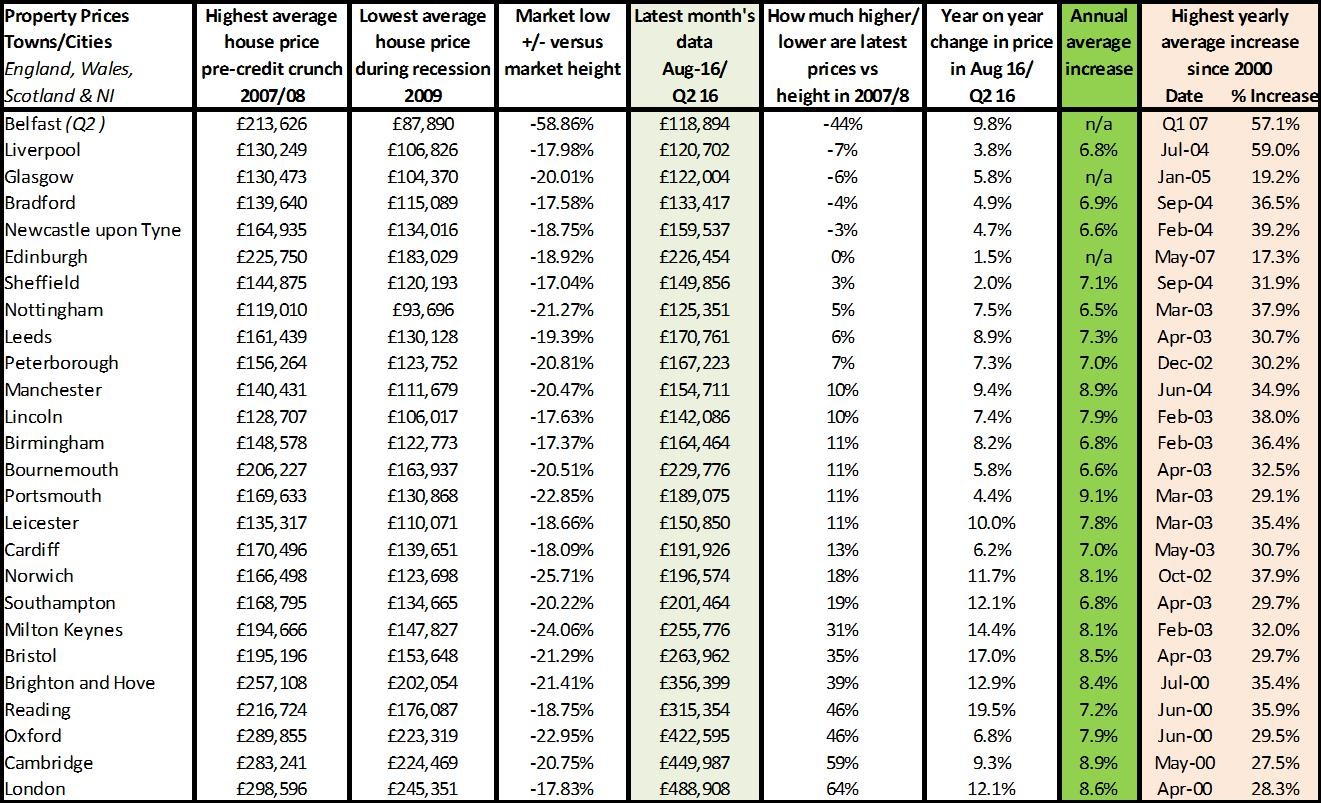
What's happening in your town or city?
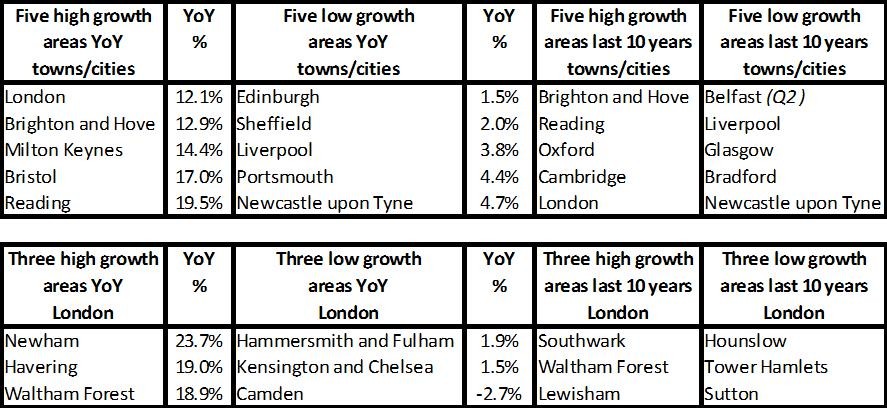
Source: UK HPI
Hometrack’s City Index shows strong growth in the areas where prices are pretty affordable - of 6-8% in Manchester and Cardiff while the power houses of Cambridge and London are hitting affordability buffers and running out of steam following post-recession rapid growth. So for agents and surveyors the reality is that local property knowledge is key to helping buyers, sellers and investors! Double-digit rates are still being seen in the likes of Bristol, Reading, Southampton and even Leicester, according to the UKHPI Index. However, most individual town and city performances are similar to that of the regions highlighted by LSL; there are three levels of performance, albeit slightly higher, with some in double digits, some in the 6-9% bracket and some below this. Some towns and cities - including Liverpool, Bradford and Glasgow - still haven’t recovered to 2007 levels.
Looking sell in good time? Read our how to sell quickly checklist.
